• Home
  • About Me
  • Log In
    • Membership Account
  • Blog
  • Educational Material
    • Live Trade Setups
    • Trade Executions Techniques
    • Videos
  • Psychology & Performance
    • Emotional Regulation
    • Gus’s Key Trading Rules
    • Trading Psychology
    • Daily Mental Preparation
  • Services
    • Trading Performance & Mindset Group
    • Ninjatrader -Mindset & Performance Add-on
    • Mentoring & Coaching For Traders
  • Shopping Cart
  • Contact Us
  • Risk Disclaimer
Contact
Login

Login
Trading Performance HubTrading Performance Hub
  • Home
  • About Me
  • Blog
  • Trading
    • Trading Setups & Posts
    • Trading Charts Examples
    • Trade Executions
    • Gus’s Key Trading Rules
  • Psychology
    • Trading Performance Mindset
    • Emotional Intelligence & Self-Mastery Tools
      • Emotional Regulation
      • Mindfulness Practice
      • FasterEFT Tapping
    • Trading Mental Preparation
    • Related Videos
  • Trading Group
  • TPT-Toolkit
  • Risk Disclaimer
  • Contact Us

Crude Oil Buy signal on Daily Chart T1 $40.80 T2 $41.70-$42

Crude Oil Buy signal on Daily Chart T1 $40.80 T2 $41.70-$42

8 October 2020 Swing Setup, Trade Setup

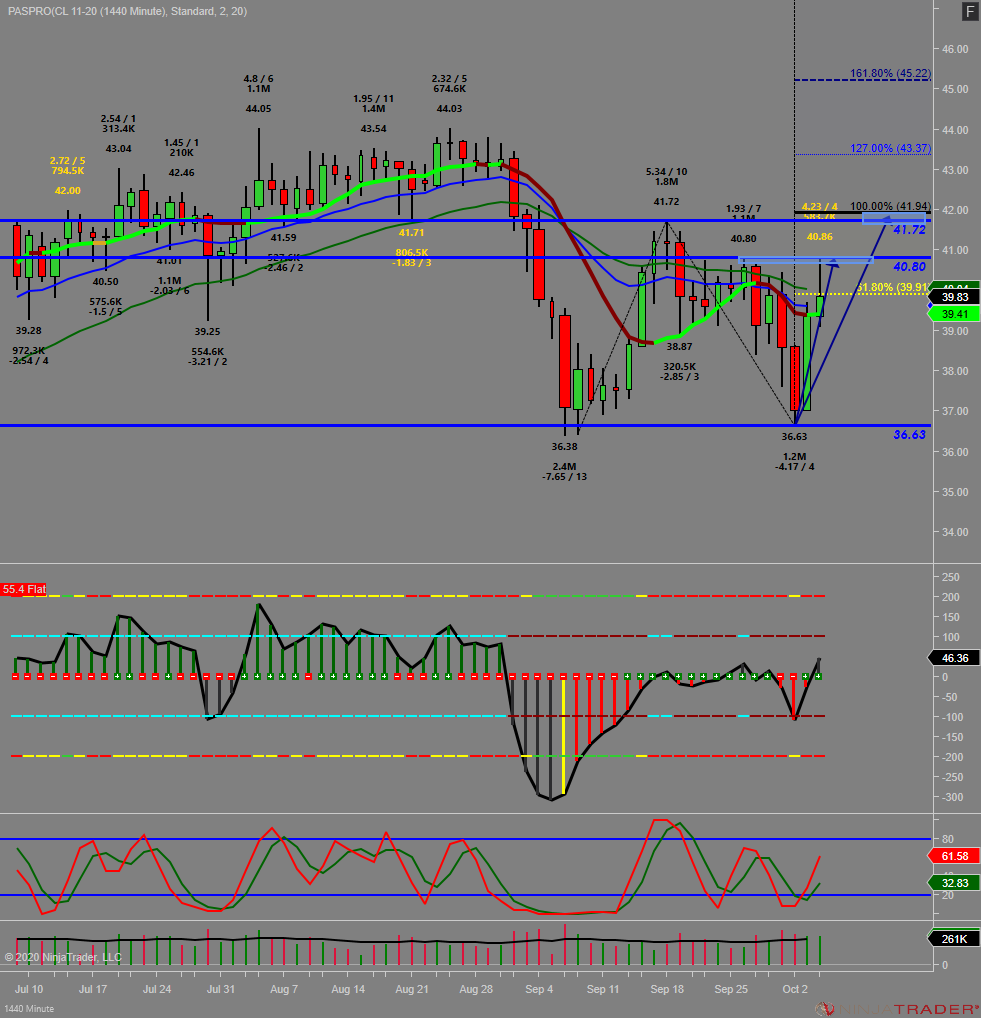
VT trigged on daily chart for initial target T1 40.80 Followed by T2 41.72-42

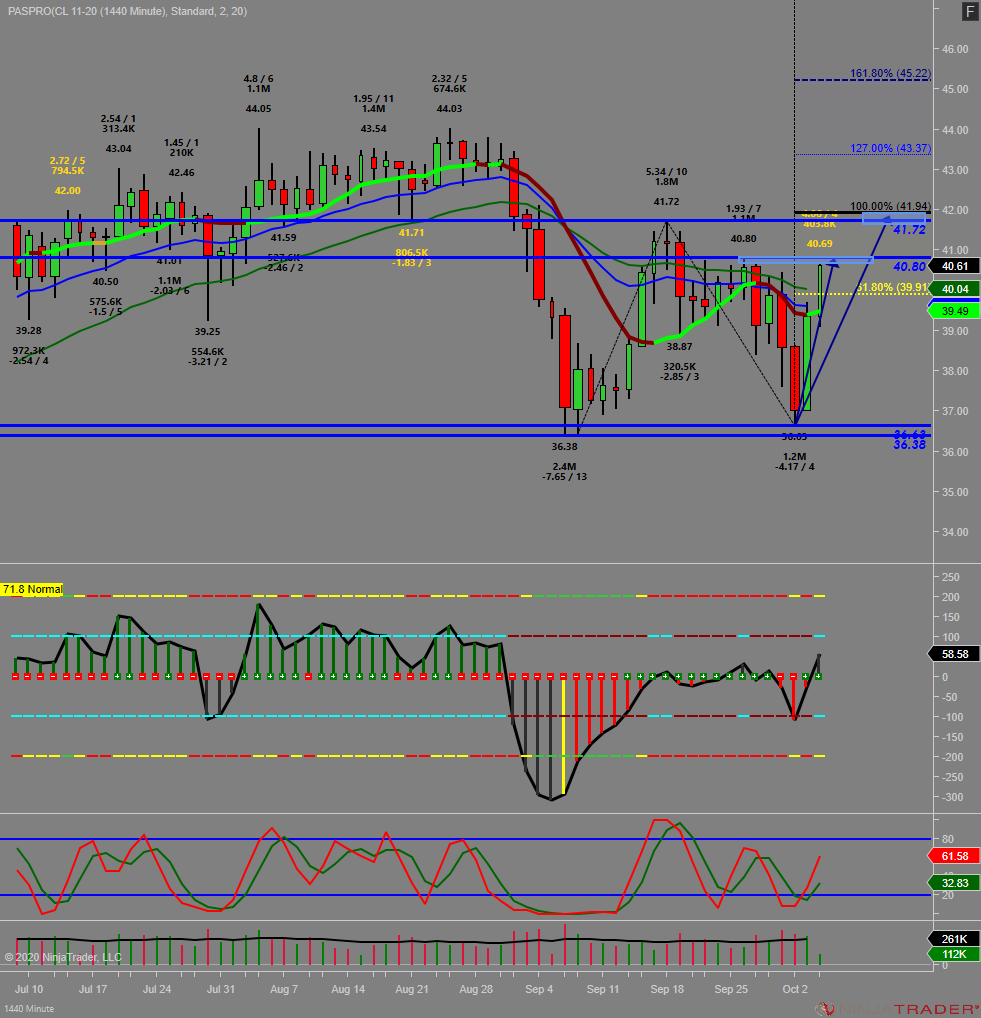
#CL_F heading to 40.80 zone swing high target T1 followed by 41.72-42 protected T2 zone #daytrading #trading $crude #futures #crude #ES_F pic.twitter.com/PZQHBuCLe9

— Gus Joury (@Gussj) October 6, 2020

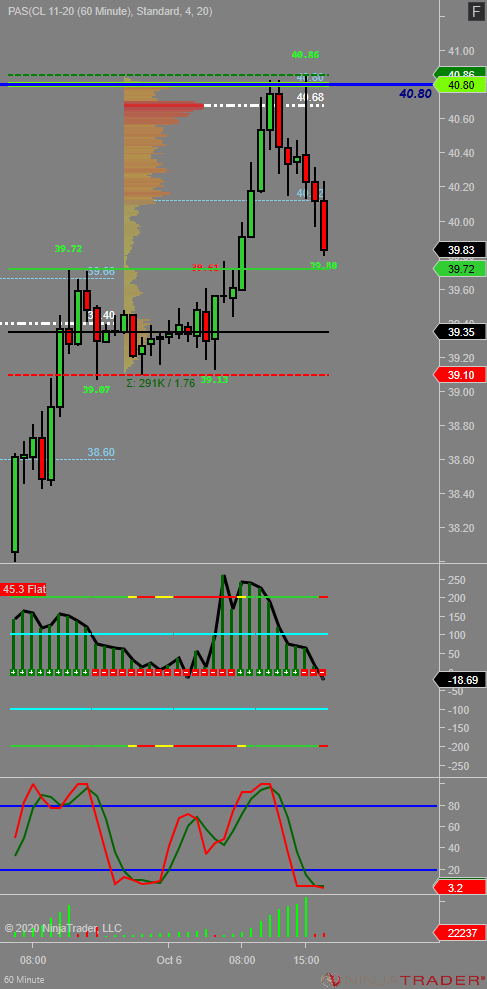
WE hit out target T1 40.80 and pulled back form that level so far #trading #futures #CL_F #crude #daytrading #ES_F pic.twitter.com/Ntp2AaNpD4

— Gus Joury (@Gussj) October 6, 2020

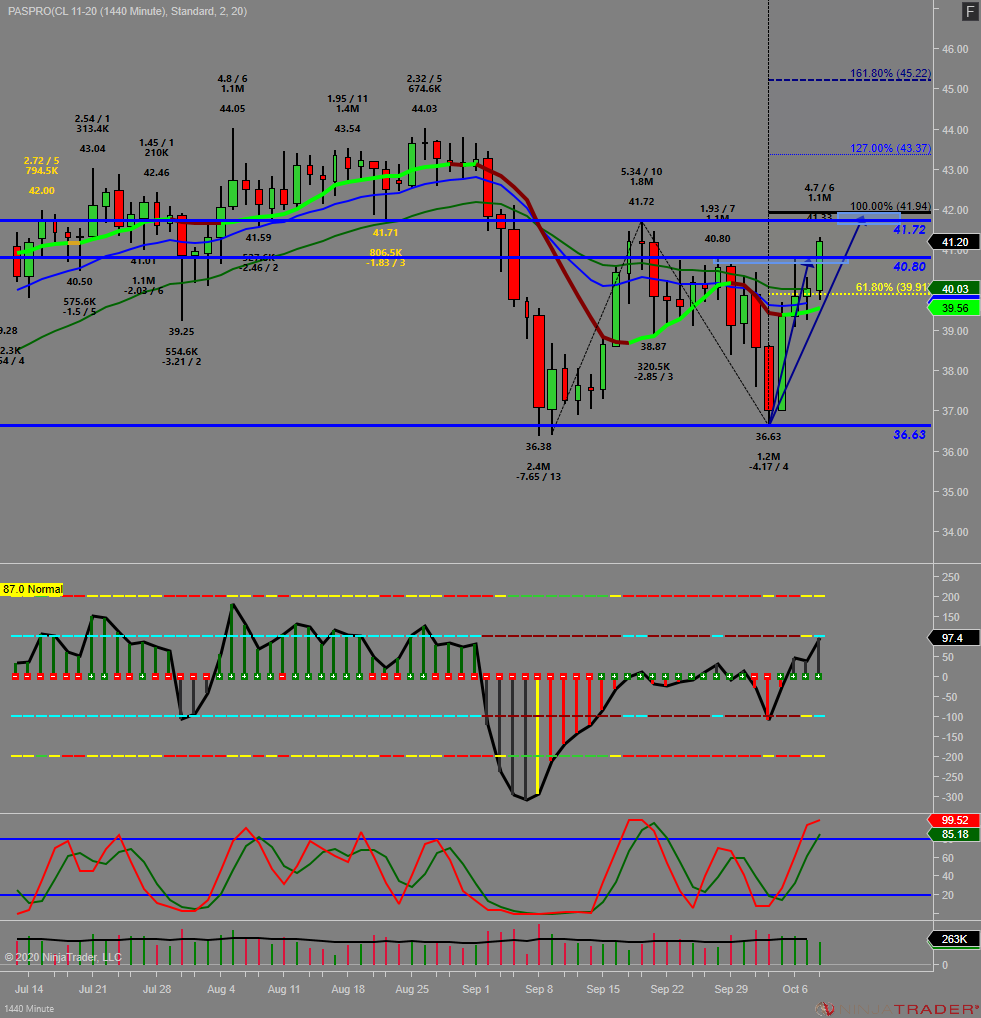
#CL_F Breaking higher towards T2 41.72-42 following a 37.5% pullback #trading #crude $oil #Futures pic.twitter.com/84m2FHRdcx

— Gus Joury (@Gussj) October 8, 2020

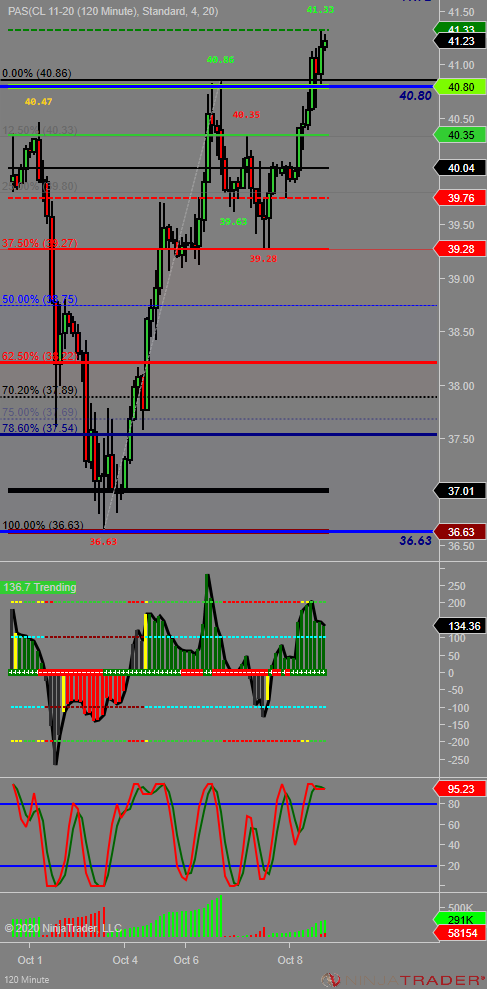
#CL_F Bouncing off prior T1 resistance 40.80 (acting as support ) for continuation towards T2 41.72-42 zone #crude #futures #daytrading $oil $wti #swing #trading pic.twitter.com/cXRiSIu8TJ

— Gus Joury (@Gussj) October 9, 2020
Share

You also might be interested in

October 1st, Soybean reach initial projected target 914

October 1st, Soybean reach initial projected target 914

Oct 1, 2019

How to spot buyers in real time using Volume Profile /Divergence & swing volume analysis

How to spot buyers in real time using Volume Profile /Divergence & swing volume analysis

Jan 14, 2021

Using volume profile to spot buyers. with cumulative delta divergence[...]

USD.CAD Forex trading

Feb 6, 2023

5 min chart #forex $USDCAD #trading #Forextrading setup off last[...]

Leave a Reply Cancel Reply

Sign up for our Newsletter

Categories

  • Analysis (31)
  • CCI Setup (21)
  • Daily Time Frame (17)
  • Delta Divergence (2)
  • execution (10)
  • Fibonacci (15)
  • Forex (3)
  • Risk Mangement (8)
  • Scalp (9)
  • Swing Setup (18)
  • Trade Setup (64)
  • Trade Setups (37)
  • Trading Psychology (3)
  • Video (8)
  • volume analysis (6)
  • volumeprofile (6)

Tags:

#bonds (1) #cl_f (4) #es (1) #GC_F (1) #ZB_F (1) $gdx (1) $Mara (1) $soy (1) A+ Setup (1) analysis (3) Bitcoin (4) blog (1) BTC (1) BTCUSD (4) CCI (2) CL (3) Cl_F (1) Crude (9) daily (1) Elliotwave (1) ES (6) EURUSD (3) execution (2) Fibonacci (2) forex (2) Futures (10) GBTC (1) gc (2) GC_F (1) gold (4) MARA (1) MDR (3) performance (1) setup (2) Soybeans (6) Trade Setup (2) trading (2) USDCAD (1) video (1) volume (1) volumeprofile (1) VWAP (1) zb (1) ZS (1) zs_f (1)

Archives

Recent Posts

  • live trading ES opening drive scalps 4 May 2025
  • Consistency in Trading 22 November 2024
  • Crude oil Update for October 17th 2024 17 October 2024
  • Gold & Bonds Divergence Reversal long signal Nov 7th 2022 23 September 2024
  • USD.CAD Forex trading 23 September 2024

Twitter Feed

Tweets by Gussj

Logo

You can rely on us to get you what you need in less time and without hassle.

Contact Info

  • info@tradingperformancehub.com
  • @gussjo

Follow

LINKS

  • Free Consultation
  • Contact Us
  • Blog

FREE NEWSLETTER

Copyright © 2025 tradingperformancehub.com

Risk Disclosure:

Futures and forex trading contains substantial risk and is not for every investor. An investor could potentially lose all or more than the initial investment. Risk capital is money that can be lost without jeopardizing ones’ financial security or life style. Only risk capital should be used for trading and only those with sufficient risk capital should consider trading. Past performance is not necessarily indicative of future results.

Hypothetical Performance Disclosure:

Hypothetical performance results have many inherent limitations, some of which are described below. no representation is being made that any account will or is likely to achieve profits or losses similar to those shown; in fact, there are frequently sharp differences between hypothetical performance results and the actual results subsequently achieved by any particular trading program. One of the limitations of hypothetical performance results is that they are generally prepared with the benefit of hindsight. In addition, hypothetical trading does not involve financial risk, and no hypothetical trading record can completely account for the impact of financial risk of actual trading. for example, the ability to withstand losses or to adhere to a particular trading program in spite of trading losses are material points which can also adversely affect actual trading results. There are numerous other factors related to the markets in general or to the implementation of any specific trading program which cannot be fully accounted for in the preparation of hypothetical performance results and all which can adversely affect trading results.​

  • Risk Disclaimer
  • Privacy Policy
  • Terms & Conditions
  •  
  •  
  •  
Prev Next