
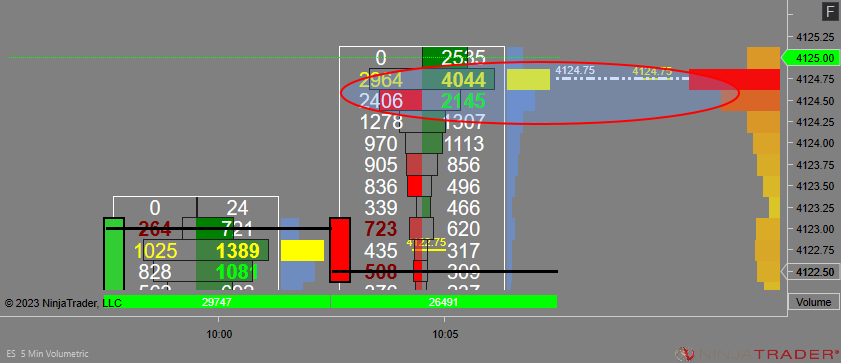
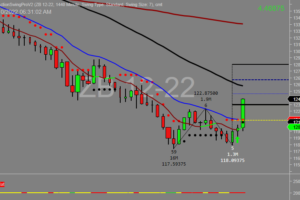
Here is a real time example on how one can see buyers & sellers coming in into a level using Footprint chart & volume profile tools, and how to take advantage of this setup.
Sellers eventually will be trapped if more buyers come in below this level. one has to be alert after a double top is out in, while market is still unable to go lower, this shows how buyers are in control below the 4125 level, and most likely a 3rd test attempt will trigger buy stops above 4125, which could start a move higher off that level, where a resistance becomes a support area to go long at after the breakout.

Leave a Reply