• Home
  • About Me
  • Log In
    • Membership Account
  • Blog
  • Educational Material
    • Live Trade Setups
    • Trade Executions Techniques
    • Videos
  • Psychology & Performance
    • Emotional Regulation
    • Gus’s Key Trading Rules
    • Trading Psychology
    • Daily Mental Preparation
  • Services
    • Trading Performance & Mindset Group
    • Ninjatrader -Mindset & Performance Add-on
    • Mentoring & Coaching For Traders
  • Shopping Cart
  • Contact Us
  • Risk Disclaimer
Contact
Login

Login
Trading Performance HubTrading Performance Hub
  • Home
  • About Me
  • Blog
  • Trading
    • Trading Setups & Posts
    • Trading Charts Examples
    • Trade Executions
    • Gus’s Key Trading Rules
  • Psychology
    • Trading Performance Mindset
    • Emotional Intelligence & Self-Mastery Tools
      • Emotional Regulation
      • Mindfulness Practice
      • FasterEFT Tapping
    • Trading Mental Preparation
    • Related Videos
  • Trading Group
  • TPT-Toolkit
  • Risk Disclaimer
  • Contact Us

Using Fibonacci levels for entries & exits with precision with 8+R Multiple on 120 min Chart

Using Fibonacci levels for entries & exits  with precision with 8+R Multiple  on 120 min Chart

Using Fibonacci levels for entries & exits with precision with 8+R Multiple on 120 min Chart

22 June 2022 Analysis, Fibonacci, Risk Mangement, Trade Setup, Trade Setups

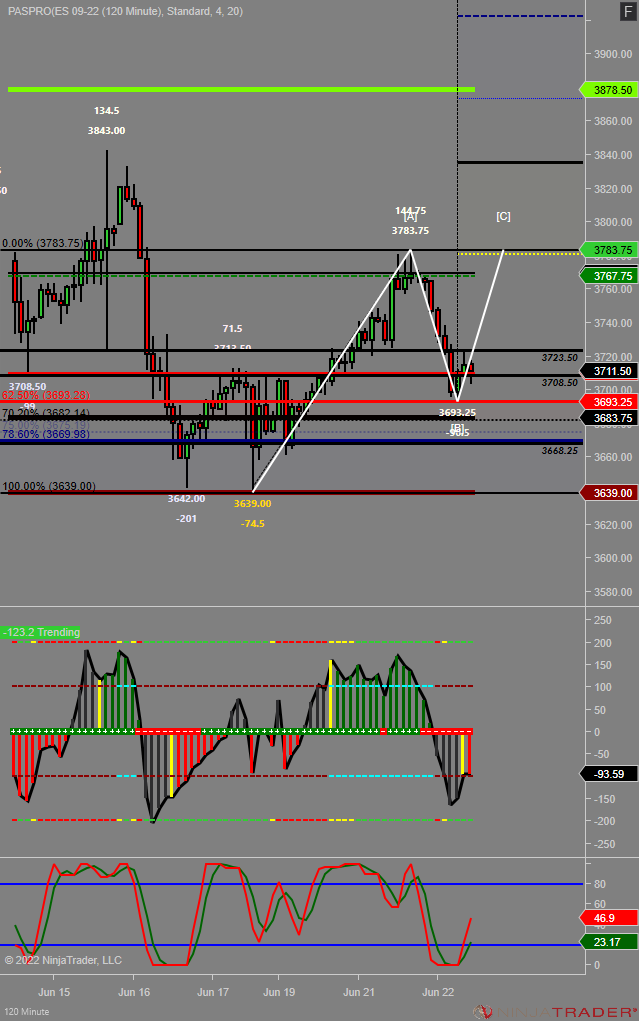
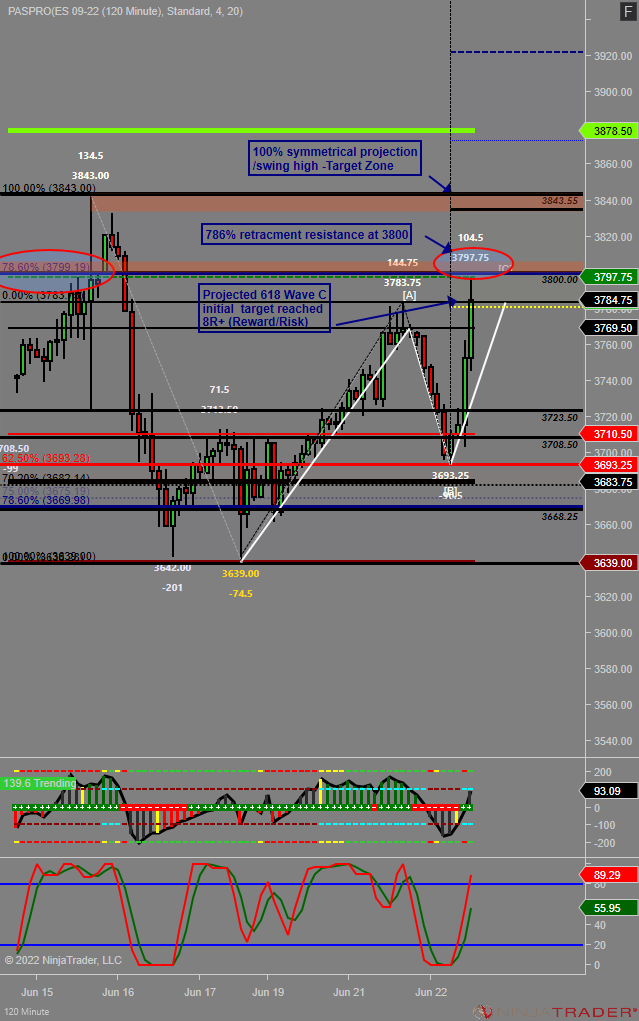
Markets tend to reverse within the 62.5%-78.6% retracement zone, this is a very high probability reversal zone where every trader must watch for possible reversal. Deep pullback zone reversal often happen in a wave2/B pullback after a possible trend reversal on higher time frame (daily in the current example).

Projecting those ABC moves give a trader an edge for high probability setup with great Reward to Risk ratio.

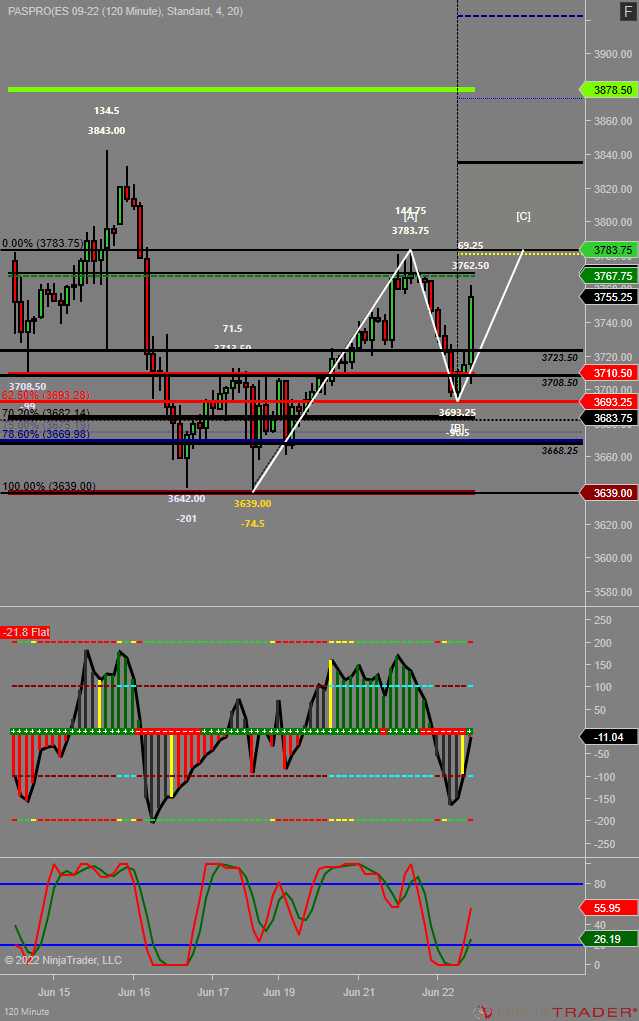
I usually use 61.8% projection (with great success rate) as my initial target followed by 100% symmetrical move projected target.

when it comes to trading, managing risk is crucial, using Fibonacci retracecment and projection gives you the edge to assess risk, and project a high probability outcome.

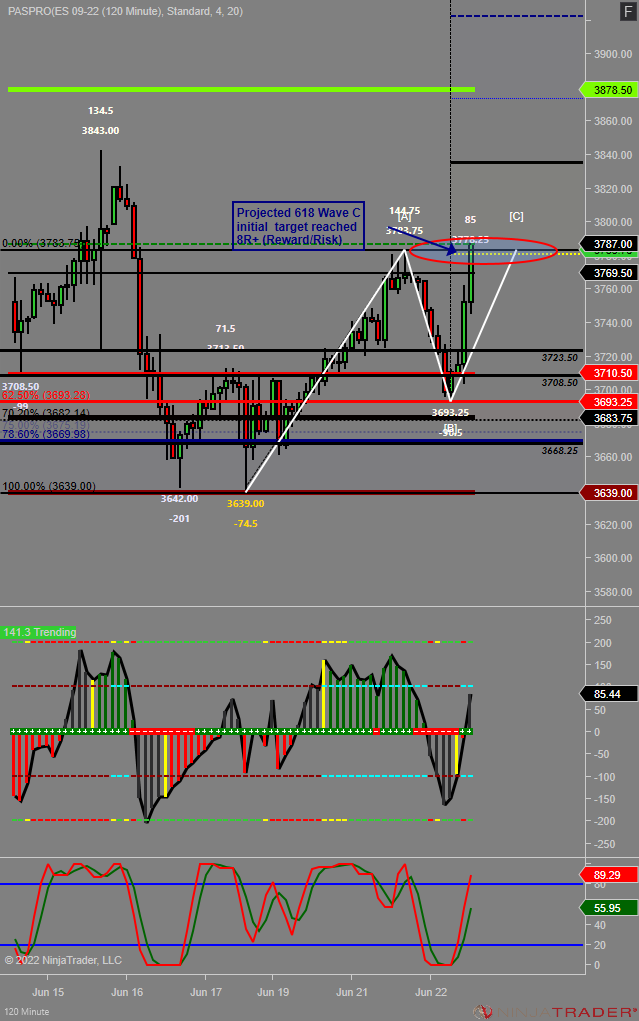
Obviously, not every trade works out perfectly like this one, but using this powerful tool can on different time frames can help traders to wait patiently for the high probability levels/zone, and using lower time frames/order-flow, momentum or volume tools to engage in the market for execution and risk management.

Hope you find this example useful.

When

A real-time step by step trade setup thread on #ES_F to get a better understanding on price structure & how I read markets using #Fibonacci levels to find high probability entries & project targets with precision & high R:R ( reward to risk) Ratio #trading #futures pic.twitter.com/NXCpeowXCr

— Gus Joury (@Gussj) June 22, 2022
Share

You also might be interested in

$MDR Follow up Trade

$MDR Follow up Trade

Oct 8, 2019

$MDR continuing higher Reaching 2nd Target/resistance zone high at 2.70[...]

EurUSD Momo sell after DT reversal

EurUSD Momo sell after DT reversal

Nov 4, 2019

$EURUSD So Far Risk:Reward 1:3 I would move stop to[...]

How to spot a high probability reversal using multiple time frame setup with low risk high reward

How to spot a high probability reversal using multiple time frame setup with low risk high reward

Aug 24, 2020

Leave a Reply Cancel Reply

Sign up for our Newsletter

Categories

  • Analysis (31)
  • CCI Setup (21)
  • Daily Time Frame (17)
  • Delta Divergence (2)
  • execution (10)
  • Fibonacci (15)
  • Forex (3)
  • Risk Mangement (8)
  • Scalp (9)
  • Swing Setup (18)
  • Trade Setup (64)
  • Trade Setups (37)
  • Trading Psychology (3)
  • Video (8)
  • volume analysis (6)
  • volumeprofile (6)

Tags:

#bonds (1) #cl_f (4) #es (1) #GC_F (1) #ZB_F (1) $gdx (1) $Mara (1) $soy (1) A+ Setup (1) analysis (3) Bitcoin (4) blog (1) BTC (1) BTCUSD (4) CCI (2) CL (3) Cl_F (1) Crude (9) daily (1) Elliotwave (1) ES (6) EURUSD (3) execution (2) Fibonacci (2) forex (2) Futures (10) GBTC (1) gc (2) GC_F (1) gold (4) MARA (1) MDR (3) performance (1) setup (2) Soybeans (6) Trade Setup (2) trading (2) USDCAD (1) video (1) volume (1) volumeprofile (1) VWAP (1) zb (1) ZS (1) zs_f (1)

Archives

Recent Posts

  • live trading ES opening drive scalps 4 May 2025
  • Consistency in Trading 22 November 2024
  • Crude oil Update for October 17th 2024 17 October 2024
  • Gold & Bonds Divergence Reversal long signal Nov 7th 2022 23 September 2024
  • USD.CAD Forex trading 23 September 2024

Twitter Feed

Tweets by Gussj

Logo

You can rely on us to get you what you need in less time and without hassle.

Contact Info

  • info@tradingperformancehub.com
  • @gussjo

Follow

LINKS

  • Free Consultation
  • Contact Us
  • Blog

FREE NEWSLETTER

Copyright © 2025 tradingperformancehub.com

Risk Disclosure:

Futures and forex trading contains substantial risk and is not for every investor. An investor could potentially lose all or more than the initial investment. Risk capital is money that can be lost without jeopardizing ones’ financial security or life style. Only risk capital should be used for trading and only those with sufficient risk capital should consider trading. Past performance is not necessarily indicative of future results.

Hypothetical Performance Disclosure:

Hypothetical performance results have many inherent limitations, some of which are described below. no representation is being made that any account will or is likely to achieve profits or losses similar to those shown; in fact, there are frequently sharp differences between hypothetical performance results and the actual results subsequently achieved by any particular trading program. One of the limitations of hypothetical performance results is that they are generally prepared with the benefit of hindsight. In addition, hypothetical trading does not involve financial risk, and no hypothetical trading record can completely account for the impact of financial risk of actual trading. for example, the ability to withstand losses or to adhere to a particular trading program in spite of trading losses are material points which can also adversely affect actual trading results. There are numerous other factors related to the markets in general or to the implementation of any specific trading program which cannot be fully accounted for in the preparation of hypothetical performance results and all which can adversely affect trading results.​

  • Risk Disclaimer
  • Privacy Policy
  • Terms & Conditions
  •  
  •  
  •  
Prev Next